Os02g0624300
blastp(Os)/ blastp(At)/ coex/// RAP/ RiceXPro/ SALAD/ ATTED-II
Description : Similar to Y19 protein.

FiT-DB / Search/ Help/ Sample detail
|
Os02g0624300 |
blastp(Os)/ blastp(At)/ coex/// RAP/ RiceXPro/ SALAD/ ATTED-II |
|
Description : Similar to Y19 protein.
|
|
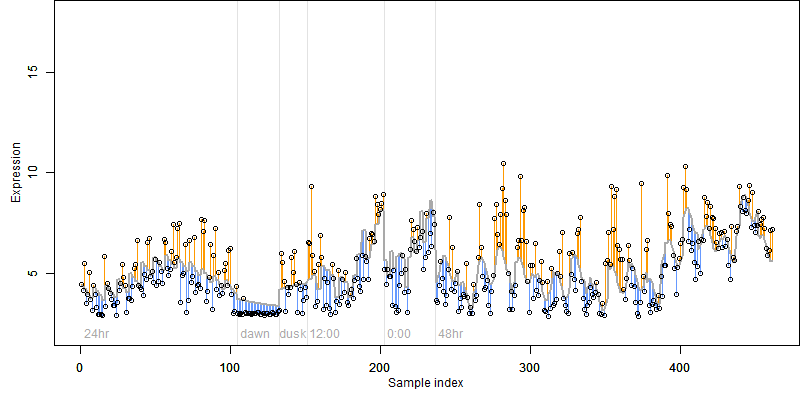
log2(Expression) ~ Norm(μ, σ2)
μ = α + β1D + β2C + β3E + β4D*C + β5D*E + γ1N8
|
_____ |
|
 __
__
Dependence on each variable

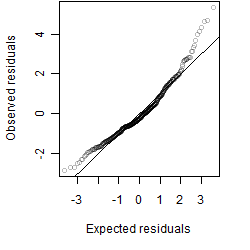
Residual plot

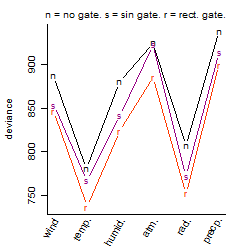
Process of the parameter reduction
(fixed parameters. wheather = temperature,
response mode = > th, dose dependency = dose dependent, type of G = rect.)
| deviance | σ | α | β1 | β2 | β3 | β4 | β5 | γ1 | peak time of C | threshold | memory length | peak or start time of G | open length of G |
|---|---|---|---|---|---|---|---|---|---|---|---|---|---|
| 730.61 | 1.27 | 5.11 | 4.26 | 1.35 | -3.39 | 0.539 | 2.85 | 0.152 | 20.7 | 24.75 | 1416 | 15.4 | 0.79 |
| 732.76 | 1.26 | 5.17 | 3.51 | 1.35 | -3.34 | 0.629 | -- | 0.114 | 20.7 | 22.57 | 1427 | 15.5 | 0.633 |
| 729 | 1.26 | 5.11 | 4.2 | 1.36 | -3.42 | -- | 2.72 | 0.182 | 20.6 | 23.92 | 1415 | 15.4 | 0.799 |
| 733.38 | 1.26 | 5.18 | 3.48 | 1.35 | -3.36 | -- | -- | 0.0926 | 20.9 | 22.6 | 1429 | 15.5 | 0.667 |
| 832.09 | 1.34 | 5.1 | 4.25 | -- | -3.48 | -- | 2.88 | 0.162 | -- | 23.65 | 1413 | 15.4 | 0.85 |
| 1162.91 | 1.6 | 5.27 | 2.35 | 1.37 | -- | 0.766 | -- | -0.276 | 19.9 | -- | -- | -- | -- |
| 1164.49 | 1.6 | 5.27 | 2.33 | 1.37 | -- | -- | -- | -0.276 | 20.1 | -- | -- | -- | -- |
| 837.07 | 1.35 | 5.18 | 3.47 | -- | -3.34 | -- | -- | 0.0642 | -- | 22.53 | 1425 | 15.5 | 0.733 |
| 1027.64 | 1.49 | 5.26 | -- | 1.29 | -2.65 | -- | -- | -0.245 | 21 | 22.4 | 1427 | 15.7 | 0.5 |
| 1266.65 | 1.66 | 5.23 | 2.31 | -- | -- | -- | -- | -0.293 | -- | -- | -- | -- | -- |
| 1307.01 | 1.69 | 5.33 | -- | 1.35 | -- | -- | -- | -0.535 | 20.2 | -- | -- | -- | -- |
| 1124.97 | 1.56 | 5.22 | -- | -- | -2.57 | -- | -- | -0.314 | -- | 22.55 | 1408 | 15.7 | 0.917 |
| 1407.78 | 1.75 | 5.29 | -- | -- | -- | -- | -- | -0.55 | -- | -- | -- | -- | -- |
Results of the grid search
Summarized heatmap of deviance
|
Histogram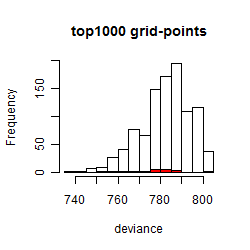 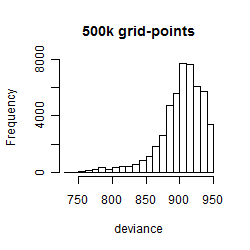
|
Local optima within top1000 grid-points
| rank | deviance | wheather | threshold | memory length | response mode | dose dependency | type of G | peak or start time of G | open length of G |
|---|---|---|---|---|---|---|---|---|---|
| 1 | 736.37 | temperature | 25 | 1440 | > th | dose dependent | rect. | 15 | 1 |
| 12 | 751.92 | radiation | 1 | 1440 | < th | dose independent | rect. | 8 | 22 |
| 34 | 758.21 | radiation | 1 | 1440 | > th | dose independent | rect. | 8 | 22 |
| 53 | 761.65 | temperature | 10 | 1440 | > th | dose dependent | rect. | 15 | 1 |
| 105 | 766.52 | temperature | 25 | 1440 | > th | dose dependent | sin | 19 | NA |
| 129 | 768.07 | radiation | 1 | 1440 | < th | dose dependent | rect. | 8 | 22 |
| 176 | 771.61 | radiation | 1 | 1440 | < th | dose independent | sin | 15 | NA |
| 252 | 776.88 | radiation | 1 | 1440 | > th | dose independent | sin | 15 | NA |
| 257 | 777.01 | temperature | 25 | 1440 | > th | dose dependent | rect. | 2 | 17 |
| 323 | 778.97 | radiation | 1 | 1440 | < th | dose dependent | rect. | 8 | 11 |
| 348 | 779.49 | radiation | 1 | 1440 | < th | dose dependent | rect. | 8 | 14 |
| 378 | 780.08 | radiation | 1 | 1440 | < th | dose independent | rect. | 8 | 11 |
| 398 | 780.49 | radiation | 1 | 1440 | < th | dose independent | rect. | 8 | 14 |
| 420 | 780.69 | temperature | 25 | 1440 | > th | dose dependent | no | NA | NA |
| 459 | 782.33 | radiation | 1 | 1440 | < th | dose dependent | sin | 16 | NA |
| 492 | 783.89 | radiation | 1 | 1440 | > th | dose independent | rect. | 8 | 11 |
| 561 | 785.38 | radiation | 1 | 1440 | < th | dose independent | rect. | 13 | 6 |
| 587 | 785.82 | radiation | 1 | 1440 | < th | dose independent | rect. | 13 | 9 |
| 679 | 788.81 | radiation | 1 | 1440 | > th | dose independent | rect. | 13 | 6 |
| 987 | 801.31 | radiation | 1 | 1440 | < th | dose independent | rect. | 17 | 2 |
| 999 | 801.56 | radiation | 1 | 1440 | < th | dose independent | rect. | 17 | 11 |