Os02g0584200
blastp(Os)/ blastp(At)/ coex/// RAP/ RiceXPro/ SALAD/ ATTED-II
Description : Conserved hypothetical protein.


FiT-DB / Search/ Help/ Sample detail
|
Os02g0584200 |
blastp(Os)/ blastp(At)/ coex/// RAP/ RiceXPro/ SALAD/ ATTED-II |
|
Description : Conserved hypothetical protein.
|
|
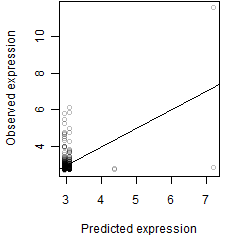
log2(Expression) ~ Norm(μ, σ2)
μ = α + β1D + β2C + β3E + β4D*C + β5D*E + γ1N8
|
_____ |
|

 __
__

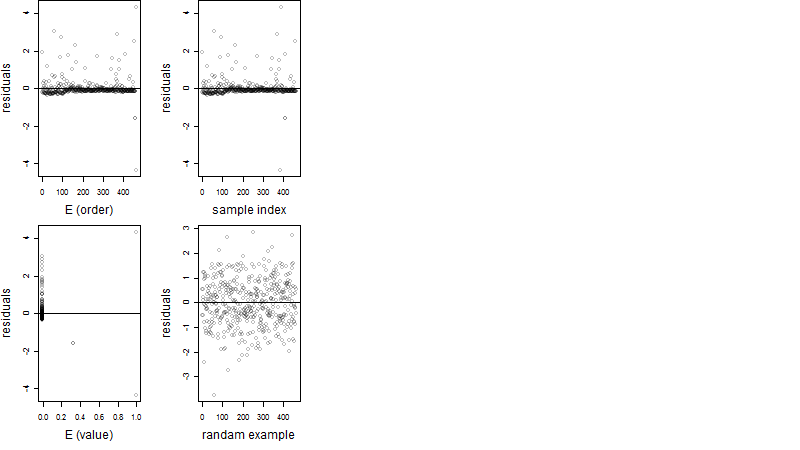
Dependence on each variable

Residual plot
Process of the parameter reduction
(fixed parameters. wheather = atmosphere,
response mode = > th, dose dependency = dose dependent, type of G = no)
| deviance | σ | α | β1 | β2 | β3 | β4 | β5 | γ1 | peak time of C | threshold | memory length | peak or start time of G | open length of G |
|---|---|---|---|---|---|---|---|---|---|---|---|---|---|
| 116.39 | 0.502 | 2.96 | 0.044 | 0.0599 | 2.29 | 0.314 | -6.18 | 0.14 | 8.23 | 1015 | 10 | -- | -- |
| 132.49 | 0.54 | 2.97 | -0.0358 | 0.0394 | 2.35 | 0.655 | -- | 0.127 | 10.4 | 1015 | 10 | -- | -- |
| 116.63 | 0.507 | 2.96 | 0.0576 | 0.0688 | 2.17 | -- | -6.1 | 0.139 | 6.52 | 1015 | 6 | -- | -- |
| 116.71 | 0.506 | 2.96 | 0.101 | 0.0695 | 4.31 | -- | -- | 0.139 | 6.69 | 1016 | 2 | -- | -- |
| 116.88 | 0.506 | 2.96 | 0.0593 | -- | 2.17 | -- | -6.1 | 0.14 | -- | 1015 | 6 | -- | -- |
| 151.44 | 0.577 | 2.98 | -0.0464 | 0.0532 | -- | -0.629 | -- | 0.0997 | 23.7 | -- | -- | -- | -- |
| 152.88 | 0.579 | 2.97 | -0.0234 | 0.0907 | -- | -- | -- | 0.101 | 3.22 | -- | -- | -- | -- |
| 116.96 | 0.506 | 2.96 | 0.103 | -- | 4.3 | -- | -- | 0.141 | -- | 1016 | 2 | -- | -- |
| 116.97 | 0.506 | 2.97 | -- | 0.0706 | 4.27 | -- | -- | 0.128 | 6.57 | 1016 | 2 | -- | -- |
| 153.35 | 0.579 | 2.97 | -0.0195 | -- | -- | -- | -- | 0.103 | -- | -- | -- | -- | -- |
| 152.9 | 0.578 | 2.97 | -- | 0.0902 | -- | -- | -- | 0.103 | 3.22 | -- | -- | -- | -- |
| 117.23 | 0.506 | 2.97 | -- | -- | 4.26 | -- | -- | 0.129 | -- | 1016 | 2 | -- | -- |
| 153.36 | 0.578 | 2.97 | -- | -- | -- | -- | -- | 0.105 | -- | -- | -- | -- | -- |
Results of the grid search
Summarized heatmap of deviance
|
Histogram 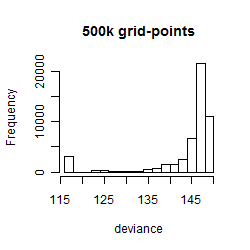
|
Local optima within top1000 grid-points
| rank | deviance | wheather | threshold | memory length | response mode | dose dependency | type of G | peak or start time of G | open length of G |
|---|---|---|---|---|---|---|---|---|---|
| 1 | 116.12 | atmosphere | 1015 | 720 | < th | dose independent | sin | 22 | NA |
| 2 | 116.21 | atmosphere | 1015 | 720 | > th | dose dependent | rect. | 3 | 21 |
| 3 | 116.24 | atmosphere | 1015 | 720 | > th | dose independent | sin | 22 | NA |
| 6 | 116.31 | atmosphere | 1015 | 10 | < th | dose independent | sin | 16 | NA |
| 9 | 116.31 | atmosphere | 1015 | 270 | < th | dose independent | sin | 18 | NA |
| 10 | 116.31 | atmosphere | 1015 | 10 | < th | dose independent | sin | 4 | NA |
| 13 | 116.31 | atmosphere | 1015 | 270 | < th | dose independent | sin | 6 | NA |
| 30 | 116.37 | atmosphere | 1015 | 720 | > th | dose independent | rect. | 22 | 1 |
| 68 | 116.38 | atmosphere | 1015 | 720 | > th | dose dependent | rect. | 22 | 1 |
| 106 | 116.39 | atmosphere | 1015 | 10 | > th | dose independent | sin | 7 | NA |
| 202 | 116.39 | atmosphere | 1015 | 10 | > th | dose independent | no | NA | NA |
| 208 | 116.39 | atmosphere | 1015 | 10 | < th | dose independent | no | NA | NA |
| 218 | 116.39 | atmosphere | 1015 | 10 | > th | dose independent | rect. | 23 | 1 |