Os02g0552700
blastp(Os)/ blastp(At)/ coex/// RAP/ RiceXPro/ SALAD/ ATTED-II
Description : Zinc finger, CCHC-type domain containing protein.


FiT-DB / Search/ Help/ Sample detail
|
Os02g0552700 |
blastp(Os)/ blastp(At)/ coex/// RAP/ RiceXPro/ SALAD/ ATTED-II |
|
Description : Zinc finger, CCHC-type domain containing protein.
|
|
log2(Expression) ~ Norm(μ, σ2)
μ = α + β1D + β2C + β3E + β4D*C + β5D*E + γ1N8
|
_____ |
|

 __
__

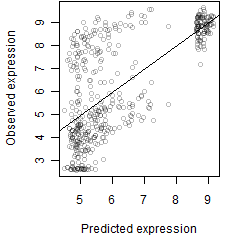
Dependence on each variable

Residual plot

Process of the parameter reduction
(fixed parameters. wheather = radiation,
response mode = < th, dose dependency = dose dependent, type of G = sin)
| deviance | σ | α | β1 | β2 | β3 | β4 | β5 | γ1 | peak time of C | threshold | memory length | peak or start time of G | open length of G |
|---|---|---|---|---|---|---|---|---|---|---|---|---|---|
| 1212.27 | 1.64 | 5.35 | 1.31 | 0.202 | 1.65 | -1.69 | 4.06 | 3.68 | 7.39 | 15.53 | 1483 | 4.55 | -- |
| 1227.9 | 1.63 | 5.36 | 1.64 | 0.253 | 1.66 | -2.05 | -- | 3.69 | 9.28 | 26.78 | 1472 | 4.87 | -- |
| 1219.12 | 1.63 | 5.35 | 1.24 | 0.23 | 1.68 | -- | 4.29 | 3.68 | 9.01 | 14.72 | 1480 | 4.67 | -- |
| 1243.09 | 1.64 | 5.36 | 1.57 | 0.259 | 1.68 | -- | -- | 3.71 | 9.4 | 26.53 | 1473 | 4.95 | -- |
| 1221.57 | 1.63 | 5.35 | 1.28 | -- | 1.64 | -- | 4.43 | 3.7 | -- | 14.73 | 1479 | 4.37 | -- |
| 1306 | 1.69 | 5.39 | 1.53 | 0.00362 | -- | -1.9 | -- | 3.55 | 8.93 | -- | -- | -- | -- |
| 1311.78 | 1.7 | 5.39 | 1.45 | 0.342 | -- | -- | -- | 3.54 | 3.41 | -- | -- | -- | -- |
| 1245.27 | 1.64 | 5.35 | 1.61 | -- | 1.59 | -- | -- | 3.71 | -- | 26.68 | 1467 | 4.4 | -- |
| 1294.65 | 1.68 | 5.35 | -- | 0.447 | 1.94 | -- | -- | 3.63 | 9.13 | 10 | 1479 | 5.91 | -- |
| 1318.37 | 1.7 | 5.39 | 1.47 | -- | -- | -- | -- | 3.55 | -- | -- | -- | -- | -- |
| 1367.32 | 1.73 | 5.42 | -- | 0.371 | -- | -- | -- | 3.38 | 3.4 | -- | -- | -- | -- |
| 1298.57 | 1.68 | 5.35 | -- | -- | 1.86 | -- | -- | 3.65 | -- | 10 | 2920 | 5.93 | -- |
| 1375.07 | 1.73 | 5.42 | -- | -- | -- | -- | -- | 3.38 | -- | -- | -- | -- | -- |
Results of the grid search
Summarized heatmap of deviance
|
Histogram 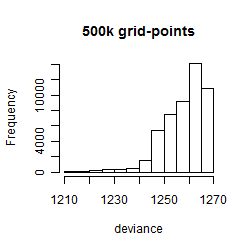
|
Local optima within top1000 grid-points
| rank | deviance | wheather | threshold | memory length | response mode | dose dependency | type of G | peak or start time of G | open length of G |
|---|---|---|---|---|---|---|---|---|---|
| 1 | 1210.85 | radiation | 1 | 1440 | > th | dose dependent | rect. | 4 | 2 |
| 12 | 1212.28 | radiation | 40 | 1440 | < th | dose dependent | rect. | 23 | 7 |
| 13 | 1212.42 | radiation | 40 | 1440 | < th | dose dependent | rect. | 20 | 10 |
| 20 | 1213.74 | radiation | 40 | 1440 | < th | dose dependent | rect. | 2 | 5 |
| 22 | 1213.79 | radiation | 30 | 1440 | < th | dose independent | rect. | 23 | 9 |
| 77 | 1215.81 | radiation | 30 | 1440 | < th | dose independent | rect. | 19 | 13 |
| 101 | 1216.41 | radiation | 1 | 1440 | > th | dose dependent | rect. | 17 | 15 |
| 128 | 1217.04 | radiation | 20 | 4320 | > th | dose dependent | rect. | 16 | 16 |
| 164 | 1218.39 | radiation | 30 | 1440 | < th | dose independent | rect. | 2 | 6 |
| 171 | 1218.77 | radiation | 1 | 1440 | > th | dose dependent | rect. | 16 | 17 |
| 172 | 1218.78 | radiation | 20 | 4320 | > th | dose dependent | rect. | 6 | 2 |
| 187 | 1218.88 | radiation | 30 | 1440 | < th | dose dependent | rect. | 16 | 17 |
| 226 | 1220.25 | radiation | 10 | 1440 | > th | dose independent | rect. | 16 | 17 |
| 247 | 1220.65 | radiation | 30 | 1440 | > th | dose independent | rect. | 16 | 16 |
| 255 | 1220.79 | radiation | 10 | 1440 | < th | dose independent | rect. | 16 | 17 |
| 272 | 1222.23 | radiation | 30 | 1440 | < th | dose independent | rect. | 6 | 2 |
| 276 | 1222.50 | radiation | 20 | 4320 | > th | dose independent | rect. | 6 | 2 |
| 299 | 1222.75 | radiation | 20 | 1440 | < th | dose dependent | sin | 10 | NA |
| 418 | 1225.99 | radiation | 1 | 1440 | > th | dose dependent | sin | 11 | NA |
| 507 | 1227.55 | radiation | 10 | 1440 | > th | dose independent | sin | 11 | NA |
| 529 | 1227.90 | radiation | 10 | 1440 | < th | dose independent | sin | 11 | NA |