Os02g0301800
blastp(Os)/ blastp(At)/ coex/// RAP/ RiceXPro/ SALAD/ ATTED-II
Description : Disease resistance protein family protein.


FiT-DB / Search/ Help/ Sample detail
|
Os02g0301800 |
blastp(Os)/ blastp(At)/ coex/// RAP/ RiceXPro/ SALAD/ ATTED-II |
|
Description : Disease resistance protein family protein.
|
|
log2(Expression) ~ Norm(μ, σ2)
μ = α + β1D + β2C + β3E + β4D*C + β5D*E + γ1N8
|
_____ |
|
 __
__

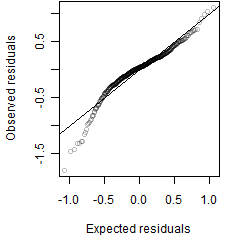
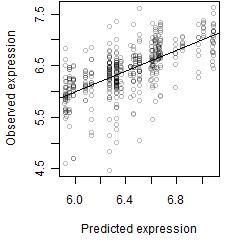
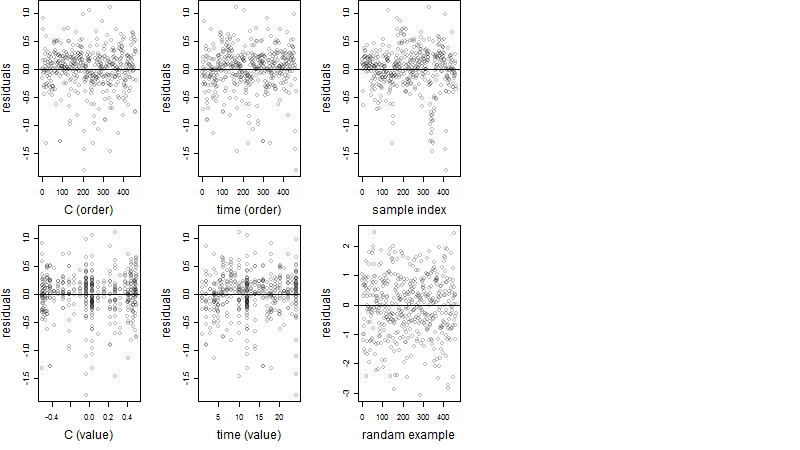
Dependence on each variable

Residual plot
Process of the parameter reduction
(fixed parameters. wheather = humidity,
response mode = < th, dose dependency = dose dependent, type of G = no)
| deviance | σ | α | β1 | β2 | β3 | β4 | β5 | γ1 | peak time of C | threshold | memory length | peak or start time of G | open length of G |
|---|---|---|---|---|---|---|---|---|---|---|---|---|---|
| 46.2 | 0.319 | 6.33 | -0.215 | 0.746 | -0.926 | -0.105 | -0.566 | 0.335 | 6.25 | 50.59 | 4576 | -- | -- |
| 46.18 | 0.316 | 6.32 | -0.166 | 0.773 | -1.17 | -0.125 | -- | 0.353 | 6.28 | 50 | 4642 | -- | -- |
| 46.05 | 0.316 | 6.33 | -0.224 | 0.742 | -0.924 | -- | -0.677 | 0.34 | 6.26 | 50 | 4638 | -- | -- |
| 46.04 | 0.316 | 6.31 | -0.189 | 0.738 | -1.2 | -- | -- | 0.342 | 6.25 | 49.84 | 4638 | -- | -- |
| 74.45 | 0.402 | 6.33 | -0.15 | -- | -1.17 | -- | -0.189 | 0.333 | -- | 49.35 | 4664 | -- | -- |
| 57.41 | 0.355 | 6.31 | -0.478 | 0.759 | -- | -0.0136 | -- | 0.376 | 6.26 | -- | -- | -- | -- |
| 57.41 | 0.355 | 6.31 | -0.478 | 0.759 | -- | -- | -- | 0.376 | 6.26 | -- | -- | -- | -- |
| 74.32 | 0.402 | 6.33 | -0.169 | -- | -1.23 | -- | -- | 0.36 | -- | 48.75 | 4664 | -- | -- |
| 46.9 | 0.319 | 6.31 | -- | 0.729 | -1.34 | -- | -- | 0.349 | 6.25 | 50.01 | 4638 | -- | -- |
| 87.29 | 0.437 | 6.32 | -0.457 | -- | -- | -- | -- | 0.392 | -- | -- | -- | -- | -- |
| 63.43 | 0.373 | 6.29 | -- | 0.752 | -- | -- | -- | 0.429 | 6.29 | -- | -- | -- | -- |
| 74.94 | 0.403 | 6.33 | -- | -- | -1.35 | -- | -- | 0.368 | -- | 49.35 | 4663 | -- | -- |
| 92.81 | 0.45 | 6.31 | -- | -- | -- | -- | -- | 0.443 | -- | -- | -- | -- | -- |
Results of the grid search
Summarized heatmap of deviance
|
Histogram 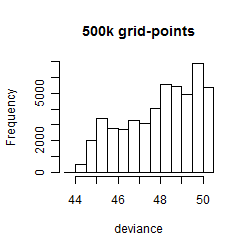
|
Local optima within top1000 grid-points
| rank | deviance | wheather | threshold | memory length | response mode | dose dependency | type of G | peak or start time of G | open length of G |
|---|---|---|---|---|---|---|---|---|---|
| 1 | 43.76 | atmosphere | 1010 | 14400 | < th | dose independent | rect. | 6 | 1 |
| 2 | 43.88 | radiation | 40 | 43200 | > th | dose independent | rect. | 13 | 1 |
| 3 | 43.88 | radiation | 20 | 43200 | > th | dose dependent | rect. | 13 | 1 |
| 5 | 43.91 | radiation | 30 | 43200 | < th | dose independent | rect. | 13 | 1 |
| 6 | 43.91 | radiation | 40 | 43200 | < th | dose dependent | rect. | 13 | 1 |
| 15 | 44.08 | atmosphere | 1010 | 14400 | > th | dose independent | rect. | 6 | 1 |
| 34 | 44.24 | radiation | 40 | 43200 | < th | dose dependent | rect. | 12 | 6 |
| 52 | 44.26 | radiation | 1 | 43200 | > th | dose dependent | rect. | 12 | 6 |
| 107 | 44.31 | radiation | 40 | 43200 | < th | dose dependent | sin | 16 | NA |
| 190 | 44.34 | radiation | 1 | 43200 | > th | dose dependent | sin | 16 | NA |
| 339 | 44.43 | radiation | 30 | 43200 | < th | dose independent | sin | 16 | NA |
| 527 | 44.52 | atmosphere | 1010 | 14400 | > th | dose dependent | rect. | 10 | 1 |
| 528 | 44.52 | radiation | 30 | 43200 | < th | dose dependent | rect. | 15 | 2 |
| 598 | 44.56 | radiation | 1 | 43200 | > th | dose dependent | rect. | 15 | 2 |
| 645 | 44.58 | radiation | 40 | 43200 | > th | dose independent | rect. | 11 | 21 |
| 651 | 44.59 | atmosphere | 1010 | 14400 | < th | dose independent | rect. | 9 | 1 |
| 704 | 44.60 | wind | 1 | 14400 | < th | dose independent | rect. | 8 | 1 |
| 721 | 44.60 | radiation | 1 | 43200 | > th | dose dependent | rect. | 15 | 15 |