Os02g0211100
blastp(Os)/ blastp(At)/ coex/// RAP/ RiceXPro/ SALAD/ ATTED-II
Description : Hypothetical protein.


FiT-DB / Search/ Help/ Sample detail
|
Os02g0211100 |
blastp(Os)/ blastp(At)/ coex/// RAP/ RiceXPro/ SALAD/ ATTED-II |
|
Description : Hypothetical protein.
|
|
log2(Expression) ~ Norm(μ, σ2)
μ = α + β1D + β2C + β3E + β4D*C + β5D*E + γ1N8
|
_____ |
|

 __
__
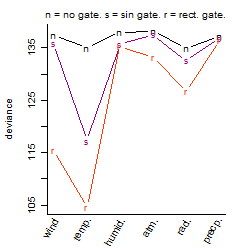
Dependence on each variable

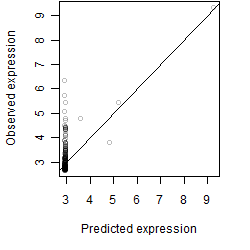
Residual plot

Process of the parameter reduction
(fixed parameters. wheather = temperature,
response mode = > th, dose dependency = dose dependent, type of G = rect.)
| deviance | σ | α | β1 | β2 | β3 | β4 | β5 | γ1 | peak time of C | threshold | memory length | peak or start time of G | open length of G |
|---|---|---|---|---|---|---|---|---|---|---|---|---|---|
| 103.66 | 0.478 | 2.96 | 0.00615 | 0.0877 | 4.31 | 0.105 | -7.8 | 0.0111 | 2.44 | 30.25 | 97 | 10.3 | 1.12 |
| 103.44 | 0.474 | 2.96 | 0.0635 | 0.103 | 3.69 | 0.298 | -- | 0.0162 | 2.01 | 30.91 | 97 | 10.6 | 1.1 |
| 102.78 | 0.472 | 2.95 | 0.028 | 0.093 | 4.52 | -- | -7.46 | 0.0077 | 2.77 | 31.06 | 102 | 10.6 | 1.13 |
| 94.15 | 0.452 | 2.96 | 0.25 | 0.0924 | 4.96 | -- | -- | 0.00801 | 2.24 | 31.47 | 83 | 10.4 | 0.259 |
| 103.15 | 0.473 | 2.96 | 0.0282 | -- | 4.69 | -- | -8.78 | 0.0102 | -- | 31.1 | 93 | 10.6 | 1.12 |
| 139.12 | 0.553 | 2.95 | 0.113 | 0.0658 | -- | -0.0992 | -- | -0.0187 | 7.55 | -- | -- | -- | -- |
| 139.15 | 0.552 | 2.95 | 0.111 | 0.0655 | -- | -- | -- | -0.0184 | 7.9 | -- | -- | -- | -- |
| 91.84 | 0.446 | 2.95 | 0.218 | -- | 6.27 | -- | -- | -0.0208 | -- | 31.59 | 83 | 10.3 | 0.404 |
| 91.02 | 0.444 | 2.97 | -- | 0.0796 | 6.27 | -- | -- | -0.0135 | 2.3 | 31.57 | 83 | 10.4 | 0.257 |
| 139.38 | 0.552 | 2.96 | 0.112 | -- | -- | -- | -- | -0.0175 | -- | -- | -- | -- | -- |
| 139.47 | 0.552 | 2.96 | -- | 0.0663 | -- | -- | -- | -0.0307 | 7.78 | -- | -- | -- | -- |
| 91.24 | 0.445 | 2.95 | -- | -- | 6.33 | -- | -- | -0.00397 | -- | 31.59 | 83 | 10.2 | 0.483 |
| 139.71 | 0.552 | 2.96 | -- | -- | -- | -- | -- | -0.0299 | -- | -- | -- | -- | -- |
Results of the grid search
Summarized heatmap of deviance
|
Histogram 
|
Local optima within top1000 grid-points
| rank | deviance | wheather | threshold | memory length | response mode | dose dependency | type of G | peak or start time of G | open length of G |
|---|---|---|---|---|---|---|---|---|---|
| 1 | 104.58 | temperature | 30 | 90 | > th | dose dependent | rect. | 10 | 1 |
| 2 | 106.19 | temperature | 30 | 90 | > th | dose independent | rect. | 10 | 1 |
| 26 | 109.97 | temperature | 30 | 10 | > th | dose independent | rect. | 11 | 1 |
| 91 | 114.99 | temperature | 30 | 270 | > th | dose independent | rect. | 8 | 3 |
| 105 | 115.49 | wind | 1 | 10 | < th | dose independent | rect. | 11 | 1 |
| 121 | 116.37 | wind | 1 | 10 | < th | dose dependent | rect. | 11 | 1 |
| 155 | 117.18 | temperature | 30 | 90 | > th | dose dependent | sin | 8 | NA |
| 229 | 120.53 | temperature | 30 | 270 | > th | dose independent | sin | 9 | NA |
| 272 | 120.92 | temperature | 30 | 270 | < th | dose independent | sin | 9 | NA |
| 347 | 123.99 | wind | 1 | 10 | < th | dose dependent | rect. | 11 | 7 |
| 469 | 126.63 | radiation | 30 | 270 | > th | dose dependent | rect. | 8 | 1 |
| 506 | 127.00 | temperature | 30 | 270 | < th | dose independent | rect. | 23 | 14 |
| 749 | 129.34 | radiation | 40 | 270 | > th | dose independent | rect. | 8 | 1 |
| 769 | 129.48 | temperature | 30 | 10 | > th | dose independent | sin | 4 | NA |