Os02g0156400
blastp(Os)/ blastp(At)/ coex/// RAP/ RiceXPro/ SALAD/ ATTED-II
Description : Leucine rich repeat, N-terminal domain containing protein.


FiT-DB / Search/ Help/ Sample detail
|
Os02g0156400 |
blastp(Os)/ blastp(At)/ coex/// RAP/ RiceXPro/ SALAD/ ATTED-II |
|
Description : Leucine rich repeat, N-terminal domain containing protein.
|
|
log2(Expression) ~ Norm(μ, σ2)
μ = α + β1D + β2C + β3E + β4D*C + β5D*E + γ1N8
|
_____ |
|

 __
__
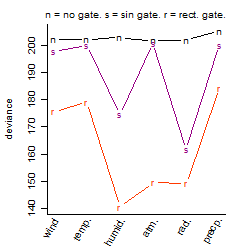
Dependence on each variable

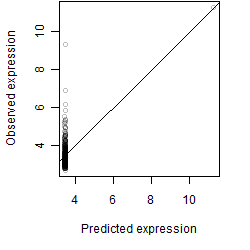
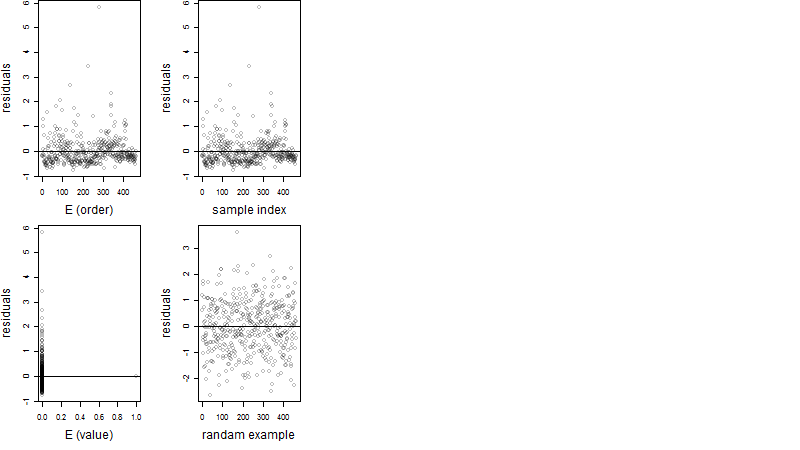
Residual plot
Process of the parameter reduction
(fixed parameters. wheather = humidity,
response mode = < th, dose dependency = dose independent, type of G = rect.)
| deviance | σ | α | β1 | β2 | β3 | β4 | β5 | γ1 | peak time of C | threshold | memory length | peak or start time of G | open length of G |
|---|---|---|---|---|---|---|---|---|---|---|---|---|---|
| 139.81 | 0.556 | 3.49 | 0.263 | 0.236 | 2.97 | 0.642 | -11.6 | 0.0577 | 4.08 | 79.91 | 100 | 1.02 | 6.99 |
| 149.56 | 0.574 | 3.48 | 0.395 | 0.311 | 7.9 | 0.271 | -- | 0.0348 | 5.08 | 66.43 | 3 | 1.62 | 8.32 |
| 140.6 | 0.552 | 3.49 | 0.254 | 0.26 | 2.94 | -- | -11.4 | 0.0546 | 5.22 | 79.96 | 98 | 1.02 | 6.99 |
| 149.67 | 0.574 | 3.48 | 0.394 | 0.317 | 7.84 | -- | -- | 0.0335 | 5.49 | 68.27 | 2 | 1.62 | 8.35 |
| 143.99 | 0.559 | 3.5 | 0.262 | -- | 3.07 | -- | -11.4 | 0.0622 | -- | 79.92 | 100 | 0.99 | 7.03 |
| 209.11 | 0.678 | 3.49 | 0.269 | 0.368 | -- | -0.802 | -- | -0.00575 | 6.74 | -- | -- | -- | -- |
| 210.26 | 0.679 | 3.49 | 0.253 | 0.379 | -- | -- | -- | -0.0052 | 5.85 | -- | -- | -- | -- |
| 154.89 | 0.582 | 3.49 | 0.407 | -- | 7.97 | -- | -- | 0.0418 | -- | 68.27 | 2 | 1.62 | 8.35 |
| 153.74 | 0.581 | 3.49 | -- | 0.325 | 7.66 | -- | -- | -0.011 | 5.45 | 68.24 | 2 | 1.6 | 8.33 |
| 217.72 | 0.689 | 3.5 | 0.265 | -- | -- | -- | -- | 0.00364 | -- | -- | -- | -- | -- |
| 211.95 | 0.681 | 3.5 | -- | 0.383 | -- | -- | -- | -0.0334 | 5.82 | -- | -- | -- | -- |
| 159.22 | 0.59 | 3.5 | -- | -- | 7.78 | -- | -- | -0.00392 | -- | 68.33 | 2 | 1.58 | 8.34 |
| 219.57 | 0.692 | 3.5 | -- | -- | -- | -- | -- | -0.0257 | -- | -- | -- | -- | -- |
Results of the grid search
Summarized heatmap of deviance
|
Histogram 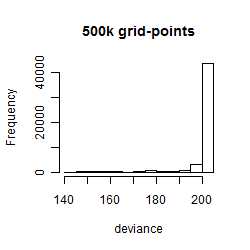
|
Local optima within top1000 grid-points
| rank | deviance | wheather | threshold | memory length | response mode | dose dependency | type of G | peak or start time of G | open length of G |
|---|---|---|---|---|---|---|---|---|---|
| 1 | 140.46 | humidity | 80 | 90 | < th | dose independent | rect. | 1 | 7 |
| 4 | 142.23 | humidity | 80 | 90 | < th | dose independent | rect. | 4 | 4 |
| 10 | 144.54 | humidity | 80 | 10 | < th | dose dependent | rect. | 5 | 3 |
| 14 | 144.69 | humidity | 80 | 10 | < th | dose dependent | rect. | 2 | 6 |
| 21 | 145.14 | humidity | 80 | 10 | < th | dose independent | rect. | 6 | 2 |
| 43 | 146.46 | humidity | 80 | 10 | < th | dose dependent | rect. | 20 | 12 |
| 69 | 149.01 | humidity | 70 | 90 | < th | dose dependent | rect. | 18 | 14 |
| 71 | 149.08 | humidity | 70 | 30 | < th | dose independent | rect. | 18 | 14 |
| 78 | 149.14 | radiation | 10 | 10 | > th | dose dependent | rect. | 16 | 16 |
| 79 | 149.18 | radiation | 20 | 90 | > th | dose independent | rect. | 6 | 1 |
| 93 | 149.18 | radiation | 20 | 90 | > th | dose dependent | rect. | 6 | 1 |
| 113 | 149.25 | radiation | 10 | 10 | > th | dose dependent | rect. | 6 | 2 |
| 261 | 149.52 | atmosphere | 1005 | 10 | > th | dose dependent | rect. | 7 | 1 |
| 786 | 161.57 | radiation | 30 | 10 | < th | dose independent | sin | 11 | NA |
| 851 | 168.50 | atmosphere | 1005 | 10 | > th | dose independent | rect. | 7 | 1 |
| 905 | 171.52 | radiation | 10 | 10 | > th | dose dependent | sin | 11 | NA |
| 943 | 173.94 | radiation | 20 | 10 | > th | dose independent | sin | 11 | NA |
| 963 | 174.59 | humidity | 70 | 10 | < th | dose independent | sin | 11 | NA |
| 987 | 175.52 | wind | 7 | 30 | > th | dose dependent | rect. | 1 | 10 |