Os01g0819300
blastp(Os)/ blastp(At)/ coex/// RAP/ RiceXPro/ SALAD/ ATTED-II
Description : Conserved hypothetical protein.


FiT-DB / Search/ Help/ Sample detail
|
Os01g0819300 |
blastp(Os)/ blastp(At)/ coex/// RAP/ RiceXPro/ SALAD/ ATTED-II |
|
Description : Conserved hypothetical protein.
|
|
log2(Expression) ~ Norm(μ, σ2)
μ = α + β1D + β2C + β3E + β4D*C + β5D*E + γ1N8
|
_____ |
|

 __
__
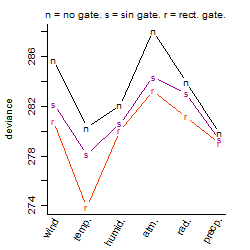
Dependence on each variable

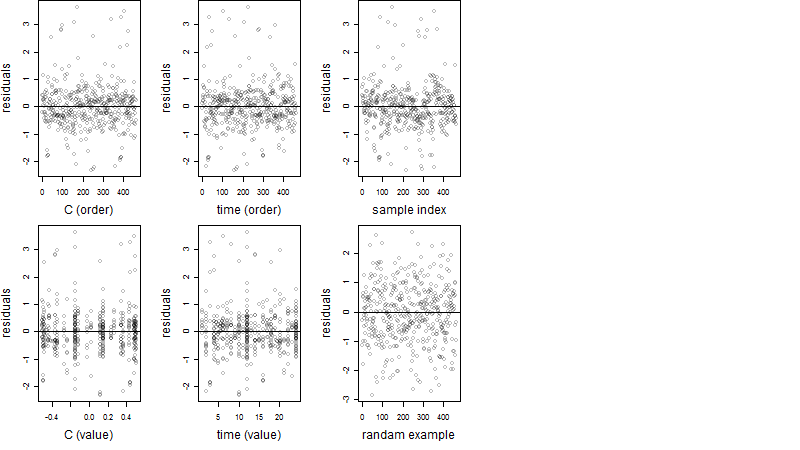
Residual plot
Process of the parameter reduction
(fixed parameters. wheather = precipitation,
response mode = > th, dose dependency = dose dependent, type of G = no)
| deviance | σ | α | β1 | β2 | β3 | β4 | β5 | γ1 | peak time of C | threshold | memory length | peak or start time of G | open length of G |
|---|---|---|---|---|---|---|---|---|---|---|---|---|---|
| 277.88 | 0.783 | 4.78 | -0.0824 | 0.79 | 0.24 | -0.117 | 2.5 | -0.326 | 4.8 | 0.1599 | 6830 | -- | -- |
| 280.13 | 0.78 | 4.85 | -0.116 | 0.801 | 0.711 | -0.0534 | -- | -0.342 | 4.96 | 0.5003 | 19813 | -- | -- |
| 277.74 | 0.776 | 4.78 | -0.0516 | 0.813 | 0.269 | -- | 2.67 | -0.319 | 4.74 | 0.231 | 7170 | -- | -- |
| 279.1 | 0.778 | 4.81 | -0.174 | 0.832 | 0.793 | -- | -- | -0.298 | 4.86 | 0.516 | 19812 | -- | -- |
| 310.82 | 0.821 | 4.78 | -0.0424 | -- | 0.206 | -- | 3.15 | -0.311 | -- | 0.1467 | 7136 | -- | -- |
| 294.2 | 0.804 | 4.82 | 0.13 | 0.797 | -- | 0.00459 | -- | -0.36 | 4.89 | -- | -- | -- | -- |
| 294.2 | 0.803 | 4.82 | 0.13 | 0.797 | -- | -- | -- | -0.36 | 4.89 | -- | -- | -- | -- |
| 313.15 | 0.824 | 4.81 | -0.216 | -- | 0.806 | -- | -- | -0.274 | -- | 0.5001 | 19812 | -- | -- |
| 280.43 | 0.78 | 4.82 | -- | 0.823 | 0.742 | -- | -- | -0.313 | 4.86 | 0.4949 | 19812 | -- | -- |
| 327.74 | 0.846 | 4.83 | 0.159 | -- | -- | -- | -- | -0.339 | -- | -- | -- | -- | -- |
| 294.65 | 0.803 | 4.83 | -- | 0.8 | -- | -- | -- | -0.374 | 4.88 | -- | -- | -- | -- |
| 314.08 | 0.825 | 4.81 | -- | -- | 0.729 | -- | -- | -0.249 | -- | 0.4954 | 19812 | -- | -- |
| 328.41 | 0.846 | 4.84 | -- | -- | -- | -- | -- | -0.357 | -- | -- | -- | -- | -- |
Results of the grid search
Summarized heatmap of deviance
|
Histogram 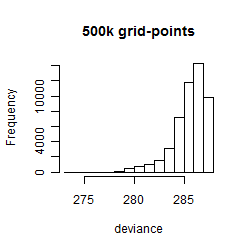
|
Local optima within top1000 grid-points
| rank | deviance | wheather | threshold | memory length | response mode | dose dependency | type of G | peak or start time of G | open length of G |
|---|---|---|---|---|---|---|---|---|---|
| 1 | 273.89 | temperature | 30.0 | 90 | < th | dose independent | rect. | 5 | 14 |
| 4 | 275.28 | temperature | 30.0 | 90 | < th | dose independent | rect. | 21 | 22 |
| 18 | 277.80 | temperature | 30.0 | 90 | < th | dose independent | rect. | 11 | 8 |
| 20 | 278.12 | temperature | 30.0 | 90 | < th | dose independent | sin | 23 | NA |
| 21 | 278.12 | temperature | 30.0 | 720 | > th | dose independent | rect. | 15 | 1 |
| 28 | 278.31 | temperature | 30.0 | 720 | < th | dose independent | rect. | 20 | 21 |
| 29 | 278.33 | temperature | 30.0 | 720 | < th | dose independent | rect. | 6 | 9 |
| 34 | 278.48 | temperature | 30.0 | 720 | > th | dose independent | rect. | 11 | 5 |
| 54 | 278.55 | temperature | 30.0 | 90 | < th | dose independent | rect. | 3 | 22 |
| 62 | 278.69 | temperature | 30.0 | 270 | < th | dose independent | rect. | 1 | 22 |
| 63 | 278.70 | temperature | 30.0 | 90 | < th | dose independent | rect. | 23 | 20 |
| 68 | 278.78 | temperature | 30.0 | 720 | < th | dose independent | sin | 2 | NA |
| 74 | 278.94 | temperature | 30.0 | 90 | > th | dose independent | rect. | 18 | 23 |
| 92 | 279.05 | precipitation | 0.1 | 14400 | < th | dose independent | rect. | 11 | 17 |
| 93 | 279.05 | precipitation | 0.1 | 14400 | < th | dose dependent | rect. | 11 | 17 |
| 94 | 279.06 | precipitation | 0.1 | 14400 | < th | dose independent | rect. | 17 | 11 |
| 95 | 279.06 | precipitation | 0.1 | 14400 | < th | dose dependent | rect. | 17 | 11 |
| 96 | 279.07 | precipitation | 0.1 | 14400 | < th | dose independent | rect. | 13 | 15 |
| 98 | 279.07 | precipitation | 0.1 | 14400 | < th | dose dependent | rect. | 13 | 15 |
| 103 | 279.09 | precipitation | 0.1 | 14400 | > th | dose independent | rect. | 11 | 17 |
| 105 | 279.10 | precipitation | 0.1 | 14400 | > th | dose dependent | rect. | 11 | 17 |
| 109 | 279.11 | precipitation | 0.1 | 14400 | > th | dose dependent | rect. | 13 | 15 |
| 111 | 279.12 | precipitation | 0.1 | 14400 | > th | dose independent | rect. | 17 | 11 |
| 130 | 279.18 | precipitation | 0.1 | 14400 | > th | dose dependent | rect. | 17 | 11 |
| 195 | 279.34 | precipitation | 0.1 | 14400 | < th | dose independent | sin | 15 | NA |
| 196 | 279.34 | precipitation | 0.1 | 14400 | < th | dose dependent | sin | 15 | NA |
| 202 | 279.36 | precipitation | 0.1 | 14400 | > th | dose dependent | sin | 13 | NA |
| 215 | 279.40 | precipitation | 0.1 | 14400 | > th | dose independent | sin | 15 | NA |
| 295 | 279.58 | precipitation | 0.1 | 14400 | > th | dose dependent | rect. | 17 | 22 |
| 322 | 279.64 | temperature | 30.0 | 720 | > th | dose independent | sin | 2 | NA |
| 341 | 279.67 | precipitation | 0.1 | 14400 | > th | dose dependent | rect. | 21 | 22 |
| 389 | 279.80 | precipitation | 0.1 | 14400 | > th | dose dependent | no | NA | NA |
| 398 | 279.81 | precipitation | 0.1 | 14400 | > th | dose dependent | rect. | 1 | 23 |
| 482 | 279.90 | precipitation | 0.1 | 14400 | > th | dose dependent | rect. | 19 | 23 |
| 485 | 279.92 | temperature | 30.0 | 720 | < th | dose independent | rect. | 9 | 23 |
| 495 | 279.94 | temperature | 30.0 | 90 | > th | dose independent | rect. | 9 | 8 |
| 537 | 280.03 | humidity | 70.0 | 720 | > th | dose independent | rect. | 2 | 9 |
| 539 | 280.03 | precipitation | 0.1 | 14400 | > th | dose independent | rect. | 2 | 21 |
| 544 | 280.04 | precipitation | 0.1 | 14400 | < th | dose independent | rect. | 2 | 21 |
| 548 | 280.04 | precipitation | 0.1 | 14400 | < th | dose dependent | rect. | 2 | 21 |
| 584 | 280.09 | humidity | 70.0 | 720 | > th | dose independent | rect. | 2 | 11 |
| 600 | 280.14 | precipitation | 0.1 | 14400 | > th | dose independent | rect. | 20 | 23 |
| 601 | 280.14 | precipitation | 0.1 | 14400 | < th | dose independent | rect. | 20 | 23 |
| 604 | 280.14 | precipitation | 0.1 | 14400 | < th | dose dependent | rect. | 20 | 23 |
| 626 | 280.17 | precipitation | 0.1 | 14400 | < th | dose independent | rect. | 16 | 22 |
| 628 | 280.17 | precipitation | 0.1 | 14400 | > th | dose independent | rect. | 16 | 23 |
| 632 | 280.17 | precipitation | 0.1 | 14400 | < th | dose dependent | rect. | 16 | 22 |
| 635 | 280.18 | temperature | 30.0 | 90 | > th | dose independent | sin | 23 | NA |
| 674 | 280.24 | precipitation | 0.1 | 14400 | > th | dose independent | no | NA | NA |
| 675 | 280.24 | precipitation | 0.1 | 14400 | < th | dose independent | no | NA | NA |
| 682 | 280.24 | temperature | 30.0 | 720 | > th | dose independent | rect. | 13 | 23 |
| 685 | 280.24 | precipitation | 0.1 | 14400 | < th | dose dependent | no | NA | NA |
| 690 | 280.25 | temperature | 30.0 | 720 | < th | dose independent | no | NA | NA |
| 839 | 280.44 | temperature | 30.0 | 720 | > th | dose independent | no | NA | NA |
| 951 | 280.47 | humidity | 50.0 | 720 | > th | dose dependent | rect. | 16 | 22 |
| 956 | 280.49 | temperature | 30.0 | 720 | < th | dose independent | rect. | 10 | 7 |
| 964 | 280.50 | temperature | 30.0 | 720 | < th | dose independent | rect. | 13 | 23 |