Os01g0681400
blastp(Os)/ blastp(At)/ coex/// RAP/ RiceXPro/ SALAD/ ATTED-II
Description : Similar to Autophagy protein beclin1.


FiT-DB / Search/ Help/ Sample detail
|
Os01g0681400 |
blastp(Os)/ blastp(At)/ coex/// RAP/ RiceXPro/ SALAD/ ATTED-II |
|
Description : Similar to Autophagy protein beclin1.
|
|
log2(Expression) ~ Norm(μ, σ2)
μ = α + β1D + β2C + β3E + β4D*C + β5D*E + γ1N8
|
_____ |
|

 __
__

Dependence on each variable

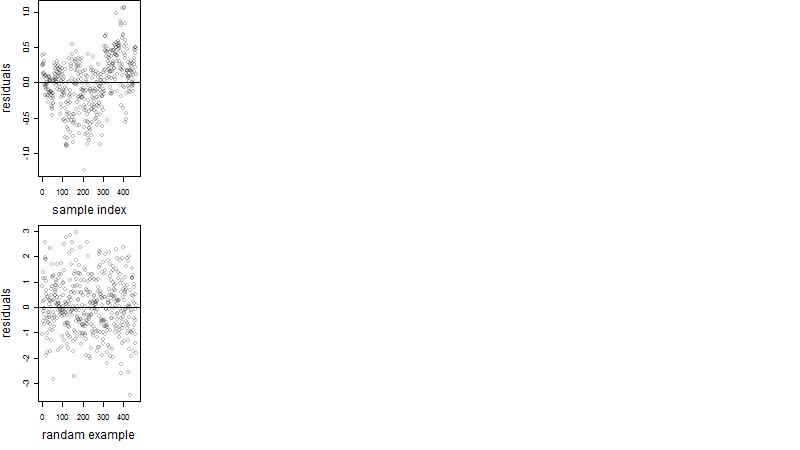
Residual plot
Process of the parameter reduction
(fixed parameters. wheather = precipitation,
response mode = > th, dose dependency = dose dependent, type of G = no)
| deviance | σ | α | β1 | β2 | β3 | β4 | β5 | γ1 | peak time of C | threshold | memory length | peak or start time of G | open length of G |
|---|---|---|---|---|---|---|---|---|---|---|---|---|---|
| 35.42 | 0.28 | 9.86 | 0.358 | 0.451 | -0.21 | -0.364 | 2.71 | -0.126 | 1.11 | 0.4453 | 10443 | -- | -- |
| 35.28 | 0.277 | 9.91 | 0.029 | 0.455 | 0.572 | -0.403 | -- | -0.0675 | 1.16 | 0.9831 | 22859 | -- | -- |
| 35.92 | 0.279 | 9.85 | 0.397 | 0.455 | -0.235 | -- | 2.77 | -0.115 | 1.02 | 0.4631 | 10441 | -- | -- |
| 35.85 | 0.279 | 9.91 | 0.0586 | 0.454 | 0.551 | -- | -- | -0.0729 | 1 | 1 | 24120 | -- | -- |
| 48.46 | 0.324 | 9.84 | 0.422 | -- | -0.257 | -- | 2.86 | -0.113 | -- | 0.4572 | 10666 | -- | -- |
| 42.73 | 0.306 | 9.92 | 0.374 | 0.454 | -- | -0.339 | -- | -0.129 | 1.08 | -- | -- | -- | -- |
| 43.2 | 0.308 | 9.92 | 0.386 | 0.454 | -- | -- | -- | -0.127 | 0.963 | -- | -- | -- | -- |
| 48.75 | 0.325 | 9.91 | 0.077 | -- | 0.542 | -- | -- | -0.0757 | -- | 1.022 | 23796 | -- | -- |
| 35.91 | 0.279 | 9.91 | -- | 0.457 | 0.579 | -- | -- | -0.0744 | 1.02 | 1 | 24657 | -- | -- |
| 56.01 | 0.35 | 9.91 | 0.403 | -- | -- | -- | -- | -0.118 | -- | -- | -- | -- | -- |
| 47.13 | 0.321 | 9.93 | -- | 0.46 | -- | -- | -- | -0.17 | 0.999 | -- | -- | -- | -- |
| 48.86 | 0.326 | 9.9 | -- | -- | 0.589 | -- | -- | -0.0679 | -- | 0.9957 | 22736 | -- | -- |
| 60.3 | 0.362 | 9.92 | -- | -- | -- | -- | -- | -0.163 | -- | -- | -- | -- | -- |
Results of the grid search
Summarized heatmap of deviance
|
Histogram 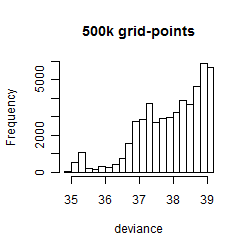
|
Local optima within top1000 grid-points
| rank | deviance | wheather | threshold | memory length | response mode | dose dependency | type of G | peak or start time of G | open length of G |
|---|---|---|---|---|---|---|---|---|---|
| 1 | 34.93 | wind | 9 | 43200 | > th | dose dependent | rect. | 18 | 3 |
| 2 | 34.97 | atmosphere | 1015 | 43200 | < th | dose dependent | rect. | 8 | 1 |
| 6 | 34.99 | atmosphere | 995 | 43200 | > th | dose dependent | rect. | 4 | 1 |
| 7 | 34.99 | atmosphere | 1015 | 43200 | < th | dose dependent | rect. | 4 | 1 |
| 15 | 35.00 | atmosphere | 995 | 43200 | > th | dose dependent | rect. | 8 | 1 |
| 31 | 35.01 | atmosphere | 995 | 43200 | > th | dose dependent | rect. | 4 | 4 |
| 49 | 35.03 | atmosphere | 1015 | 43200 | < th | dose dependent | rect. | 10 | 1 |
| 60 | 35.04 | humidity | 80 | 43200 | > th | dose independent | rect. | 18 | 1 |
| 93 | 35.07 | atmosphere | 1005 | 43200 | > th | dose independent | rect. | 6 | 1 |
| 94 | 35.07 | atmosphere | 995 | 43200 | > th | dose dependent | rect. | 10 | 1 |
| 115 | 35.09 | atmosphere | 1005 | 43200 | < th | dose independent | rect. | 6 | 1 |
| 134 | 35.10 | atmosphere | 1015 | 43200 | < th | dose dependent | sin | 4 | NA |
| 178 | 35.12 | radiation | 1 | 43200 | < th | dose dependent | rect. | 22 | 6 |
| 199 | 35.13 | atmosphere | 995 | 43200 | > th | dose dependent | sin | 4 | NA |
| 371 | 35.18 | humidity | 80 | 43200 | < th | dose independent | rect. | 17 | 2 |
| 427 | 35.19 | humidity | 80 | 43200 | > th | dose dependent | rect. | 19 | 1 |
| 493 | 35.20 | atmosphere | 1015 | 43200 | < th | dose dependent | no | NA | NA |
| 535 | 35.20 | atmosphere | 1015 | 43200 | < th | dose dependent | rect. | 6 | 23 |
| 537 | 35.20 | atmosphere | 1015 | 43200 | < th | dose dependent | rect. | 10 | 23 |
| 652 | 35.23 | atmosphere | 995 | 43200 | > th | dose dependent | no | NA | NA |
| 804 | 35.26 | atmosphere | 1015 | 43200 | < th | dose dependent | rect. | 22 | 1 |
| 853 | 35.27 | atmosphere | 1015 | 43200 | < th | dose dependent | rect. | 14 | 1 |
| 955 | 35.29 | atmosphere | 995 | 43200 | > th | dose dependent | rect. | 22 | 1 |