Os01g0382500
blastp(Os)/ blastp(At)/ coex/// RAP/ RiceXPro/ SALAD/ ATTED-II
Description : Conserved hypothetical protein.


FiT-DB / Search/ Help/ Sample detail
|
Os01g0382500 |
blastp(Os)/ blastp(At)/ coex/// RAP/ RiceXPro/ SALAD/ ATTED-II |
|
Description : Conserved hypothetical protein.
|
|
log2(Expression) ~ Norm(μ, σ2)
μ = α + β1D + β2C + β3E + β4D*C + β5D*E + γ1N8
|
_____ |
|

 __
__
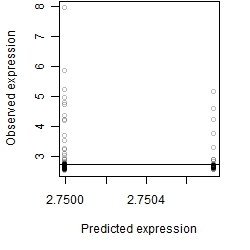
Dependence on each variable

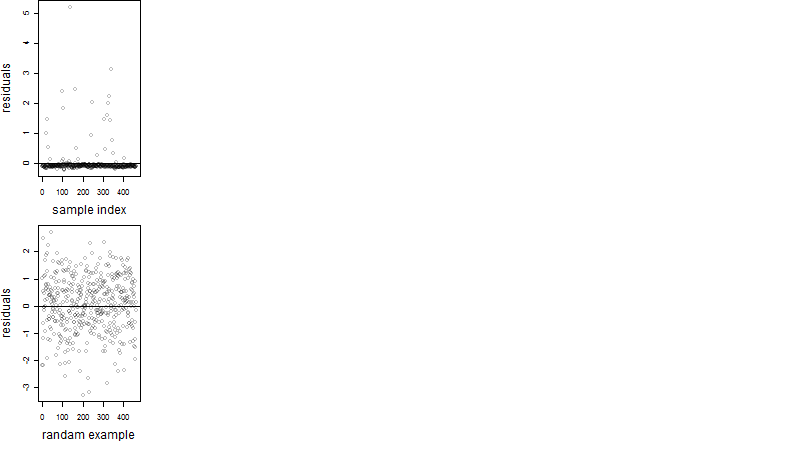
Residual plot
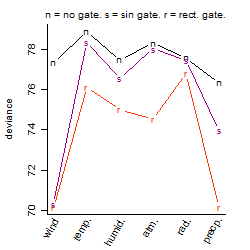
Process of the parameter reduction
(fixed parameters. wheather = precipitation,
response mode = < th, dose dependency = dose dependent, type of G = no)
| deviance | σ | α | β1 | β2 | β3 | β4 | β5 | γ1 | peak time of C | threshold | memory length | peak or start time of G | open length of G |
|---|---|---|---|---|---|---|---|---|---|---|---|---|---|
| 76.35 | 0.407 | 2.71 | 0.159 | 0.0468 | 3.99 | 0.377 | -15.4 | 0.00524 | 13 | 0.1 | 30 | -- | -- |
| 79.54 | 0.419 | 2.75 | 0.084 | 0.0486 | -0.675 | 0.263 | -- | 0.0141 | 13.8 | 0.5 | 139 | -- | -- |
| 76.85 | 0.408 | 2.71 | 0.17 | 0.0628 | 3.87 | -- | -14.9 | 0.00778 | 10.1 | 0.3446 | 30 | -- | -- |
| 79.75 | 0.416 | 2.74 | 0.0798 | 0.0538 | -0.518 | -- | -- | 0.0176 | 11.3 | 0.2941 | 139 | -- | -- |
| 77.06 | 0.409 | 2.71 | 0.168 | -- | 3.84 | -- | -14.7 | 0.00683 | -- | 0.3577 | 30 | -- | -- |
| 80.14 | 0.42 | 2.75 | 0.0958 | 0.041 | -- | 0.242 | -- | 0.0116 | 13.9 | -- | -- | -- | -- |
| 80.33 | 0.42 | 2.75 | 0.103 | 0.0462 | -- | -- | -- | 0.0126 | 11.8 | -- | -- | -- | -- |
| 79.93 | 0.416 | 2.75 | 0.0796 | -- | -0.496 | -- | -- | 0.0166 | -- | 0.2794 | 139 | -- | -- |
| 79.91 | 0.416 | 2.75 | -- | 0.0552 | -0.538 | -- | -- | 0.0107 | 11.1 | 0.3184 | 139 | -- | -- |
| 80.46 | 0.419 | 2.75 | 0.102 | -- | -- | -- | -- | 0.012 | -- | -- | -- | -- | -- |
| 80.61 | 0.42 | 2.75 | -- | 0.045 | -- | -- | -- | 0.00113 | 11.7 | -- | -- | -- | -- |
| 80.09 | 0.417 | 2.75 | -- | -- | -0.538 | -- | -- | 0.00842 | -- | 0.353 | 139 | -- | -- |
| 80.74 | 0.419 | 2.75 | -- | -- | -- | -- | -- | 0.000736 | -- | -- | -- | -- | -- |
Results of the grid search
Summarized heatmap of deviance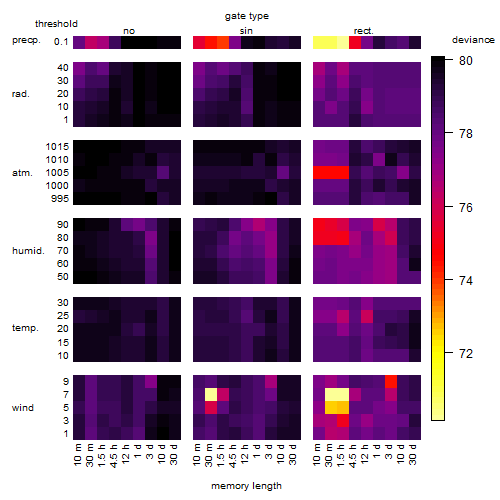
|
Histogram 
|
Local optima within top1000 grid-points
| rank | deviance | wheather | threshold | memory length | response mode | dose dependency | type of G | peak or start time of G | open length of G |
|---|---|---|---|---|---|---|---|---|---|
| 1 | 70.14 | wind | 7.0 | 90 | > th | dose independent | rect. | 20 | 1 |
| 3 | 70.14 | precipitation | 0.1 | 90 | > th | dose independent | rect. | 21 | 1 |
| 12 | 70.14 | wind | 7.0 | 90 | > th | dose dependent | rect. | 20 | 1 |
| 15 | 70.14 | precipitation | 0.1 | 90 | > th | dose dependent | rect. | 21 | 1 |
| 59 | 70.29 | wind | 7.0 | 30 | > th | dose dependent | sin | 11 | NA |
| 74 | 70.60 | wind | 7.0 | 30 | > th | dose dependent | rect. | 17 | 5 |
| 89 | 70.83 | precipitation | 0.1 | 10 | > th | dose independent | rect. | 21 | 1 |
| 100 | 70.83 | precipitation | 0.1 | 10 | > th | dose dependent | rect. | 21 | 1 |
| 183 | 71.45 | wind | 7.0 | 30 | > th | dose independent | sin | 11 | NA |
| 277 | 73.30 | wind | 7.0 | 30 | < th | dose independent | sin | 11 | NA |
| 375 | 73.95 | precipitation | 0.1 | 90 | > th | dose independent | sin | 15 | NA |
| 414 | 74.05 | precipitation | 0.1 | 90 | < th | dose independent | sin | 14 | NA |
| 417 | 74.05 | precipitation | 0.1 | 90 | < th | dose dependent | sin | 14 | NA |
| 559 | 74.48 | precipitation | 0.1 | 30 | > th | dose dependent | sin | 16 | NA |
| 560 | 74.48 | wind | 9.0 | 4320 | > th | dose dependent | rect. | 13 | 1 |
| 592 | 74.53 | atmosphere | 1005.0 | 90 | < th | dose independent | rect. | 20 | 2 |
| 767 | 75.02 | humidity | 80.0 | 90 | < th | dose independent | rect. | 2 | 2 |
| 775 | 75.02 | humidity | 90.0 | 10 | < th | dose dependent | rect. | 3 | 1 |
| 776 | 75.02 | humidity | 80.0 | 90 | < th | dose dependent | rect. | 2 | 2 |
| 899 | 75.25 | humidity | 80.0 | 10 | < th | dose independent | rect. | 3 | 1 |
| 934 | 75.33 | wind | 9.0 | 4320 | > th | dose dependent | rect. | 13 | 3 |