Os01g0116200
blastp(Os)/ blastp(At)/ coex/// RAP/ RiceXPro/ SALAD/ ATTED-II
Description : Protein kinase-like domain containing protein.


FiT-DB / Search/ Help/ Sample detail
|
Os01g0116200 |
blastp(Os)/ blastp(At)/ coex/// RAP/ RiceXPro/ SALAD/ ATTED-II |
|
Description : Protein kinase-like domain containing protein.
|
|
log2(Expression) ~ Norm(μ, σ2)
μ = α + β1D + β2C + β3E + β4D*C + β5D*E + γ1N8
|
_____ |
|

 __
__

Dependence on each variable

Residual plot

Process of the parameter reduction
(fixed parameters. wheather = atmosphere,
response mode = < th, dose dependency = dose dependent, type of G = no)
| deviance | σ | α | β1 | β2 | β3 | β4 | β5 | γ1 | peak time of C | threshold | memory length | peak or start time of G | open length of G |
|---|---|---|---|---|---|---|---|---|---|---|---|---|---|
| 60.99 | 0.364 | 269 | -1620 | 0.0991 | 50500 | 0.00998 | -309000 | -0.0533 | 7.81 | 995 | 272 | -- | -- |
| 65.51 | 0.38 | 3.19 | 0.182 | 0.0695 | 0.317 | -0.0778 | -- | -0.0602 | 8.02 | 995 | 272 | -- | -- |
| 61.04 | 0.364 | 269 | -1620 | 0.0837 | 50500 | -- | -309000 | -0.075 | 7.33 | 995 | 272 | -- | -- |
| 60.42 | 0.362 | 3.19 | 0.195 | 0.0823 | 1.65 | -- | -- | -0.0541 | 7.87 | 994.8 | 270 | -- | -- |
| 61.48 | 0.365 | 268 | -1620 | -- | 50500 | -- | -309000 | -0.0521 | -- | 995 | 272 | -- | -- |
| 65.62 | 0.38 | 3.19 | 0.185 | 0.0668 | -- | -0.0836 | -- | -0.0611 | 8.13 | -- | -- | -- | -- |
| 65.64 | 0.379 | 3.19 | 0.183 | 0.0666 | -- | -- | -- | -0.0609 | 8.34 | -- | -- | -- | -- |
| 60.9 | 0.363 | 3.19 | 0.163 | -- | 1.58 | -- | -- | -0.053 | -- | 994.8 | 268 | -- | -- |
| 61.08 | 0.364 | 3.19 | -- | 0.1 | 1.66 | -- | -- | -0.0619 | 7.73 | 994.8 | 271 | -- | -- |
| 65.89 | 0.379 | 3.19 | 0.183 | -- | -- | -- | -- | -0.0602 | -- | -- | -- | -- | -- |
| 66.52 | 0.382 | 3.19 | -- | 0.0676 | -- | -- | -- | -0.0813 | 8.14 | -- | -- | -- | -- |
| 61.61 | 0.366 | 3.19 | -- | -- | 1.6 | -- | -- | -0.0706 | -- | 994.8 | 269 | -- | -- |
| 66.77 | 0.381 | 3.2 | -- | -- | -- | -- | -- | -0.0805 | -- | -- | -- | -- | -- |
Results of the grid search
Summarized heatmap of deviance
|
Histogram 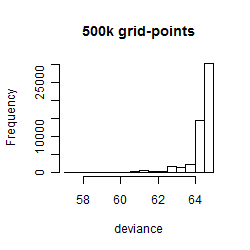
|
Local optima within top1000 grid-points
| rank | deviance | wheather | threshold | memory length | response mode | dose dependency | type of G | peak or start time of G | open length of G |
|---|---|---|---|---|---|---|---|---|---|
| 1 | 57.37 | atmosphere | 1000 | 10 | < th | dose dependent | rect. | 18 | 2 |
| 2 | 57.38 | atmosphere | 1000 | 10 | < th | dose independent | rect. | 18 | 2 |
| 6 | 57.45 | atmosphere | 1000 | 90 | < th | dose independent | rect. | 18 | 1 |
| 31 | 58.84 | humidity | 70 | 90 | < th | dose independent | rect. | 18 | 1 |
| 55 | 59.95 | atmosphere | 995 | 270 | > th | dose independent | sin | 10 | NA |
| 86 | 60.34 | atmosphere | 995 | 270 | < th | dose independent | sin | 10 | NA |
| 113 | 60.53 | atmosphere | 995 | 270 | < th | dose dependent | sin | 9 | NA |
| 141 | 60.64 | radiation | 10 | 270 | > th | dose dependent | rect. | 17 | 1 |
| 205 | 60.76 | humidity | 70 | 90 | < th | dose dependent | rect. | 18 | 1 |
| 208 | 60.77 | temperature | 30 | 270 | > th | dose dependent | rect. | 16 | 3 |
| 224 | 60.78 | temperature | 30 | 270 | > th | dose dependent | rect. | 17 | 1 |
| 227 | 60.80 | radiation | 10 | 270 | > th | dose independent | rect. | 17 | 1 |
| 364 | 61.26 | atmosphere | 995 | 270 | < th | dose dependent | no | NA | NA |
| 604 | 61.39 | temperature | 30 | 270 | > th | dose independent | rect. | 17 | 2 |
| 637 | 61.46 | atmosphere | 995 | 270 | < th | dose independent | no | NA | NA |
| 866 | 61.61 | atmosphere | 995 | 270 | > th | dose independent | rect. | 20 | 23 |
| 903 | 61.79 | atmosphere | 995 | 270 | > th | dose independent | rect. | 7 | 23 |
| 906 | 61.80 | atmosphere | 1000 | 10 | < th | dose dependent | rect. | 18 | 8 |
| 918 | 61.85 | atmosphere | 995 | 270 | > th | dose independent | no | NA | NA |